7 Best FTL Trucking Companies for Global Shipping?
Global shipping depends on more than ocean capacity. It also depends on reliable inland transport, accurate documentation, and visible handoffs. FTL trucking connects a full trailer directly with a shipper, port, warehouse, or consignee. That direct movement can reduce handling, but it may cost more when the trailer is not fully utilized.
The scale is substantial. The American Trucking Associations reported that trucking carried 72.6% of domestic freight tonnage in the United States in 2023, according to American Trucking Trends 2024. Globally, UNCTAD’s Review of Maritime Transport 2024 states that ships carry over 80% of world trade by volume. These figures show why dependable road partners matter before and after a vessel sails. The World Bank’s Logistics Performance Index 2023 also highlights customs, infrastructure, shipment quality, and timeliness as key logistics measures.
This guide reviews seven leading FTL trucking companies used in global shipping networks. The selection considers geographic coverage, fleet capability, technology, service consistency, safety practices, and experience with port-connected freight. Evidence matters. A modern tracking dashboard alone does not prove dependable performance. Rates, capacity, fuel policies, and transit times can change quickly. Even the strongest carrier may struggle during seasonal surges, severe weather, or port congestion. That limitation deserves attention.
Readers should compare service lanes, insurance terms, appointment procedures, and performance records before choosing a provider. The “best” option depends on the cargo, route, and delivery window. There is no universal winner. Firms that communicate clearly, protect shipment visibility, and recover quickly from disruptions often create the greatest practical value.
How FTL Supports Global Freight: Trucks Carry 72.7% of U.S. Tonnage (ATA)
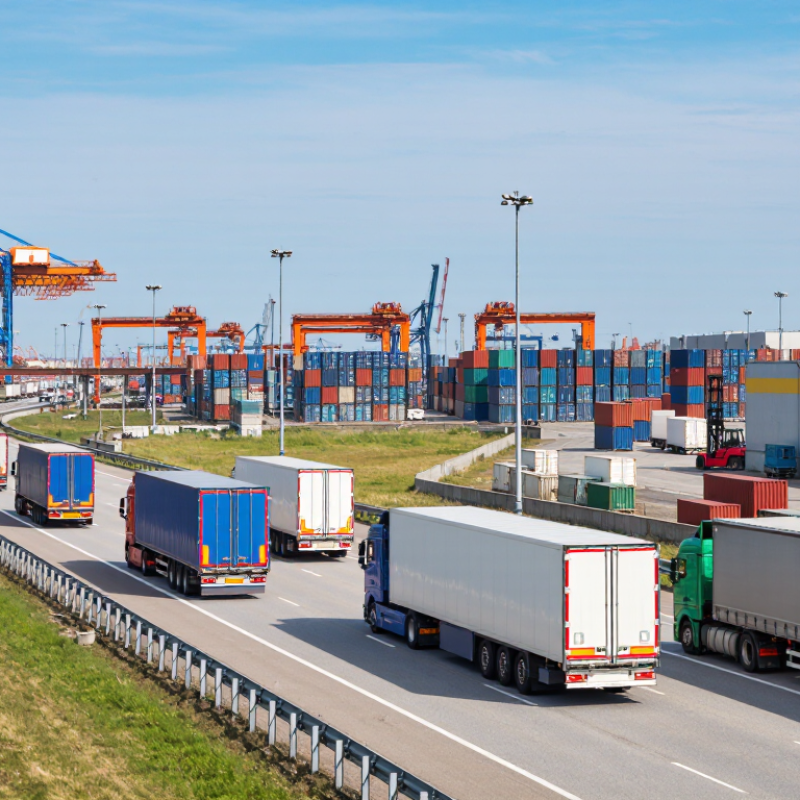
Full truckload (FTL) remains a practical link between ocean terminals, rail yards, distribution centers, and final customers. According to the American Trucking Associations (ATA), trucks carry 72.7% of U.S. freight tonnage. That figure explains why global shipping often depends on domestic road capacity. A container may cross an ocean, yet its journey still needs a truck at both ends. In daily operations, a missed pickup can disrupt an entire delivery window.
FTL uses one truck for one shipment, reducing extra handling and unnecessary transfers. It works well for pallets, temperature-sensitive goods, and time-critical production materials. Dispatch teams can match equipment, weight, route, and delivery appointment before loading. GPS updates, electronic documents, and photo-confirmed handoffs improve visibility. Small details matter: a sealed trailer, a verified reference number, and clear loading instructions can prevent hours of delay. Still, FTL is not automatically efficient. An underfilled trailer may cost more and waste capacity.
Reliable planning starts with realistic transit times, not optimistic promises. Weather, port congestion, border queues, and driver-hour limits can change the schedule. Experienced providers build buffers and communicate exceptions early. Shippers should review insurance coverage, temperature records, accessorial charges, and proof of delivery. I would also question any service that hides its limitations. Data helps, but judgment remains essential. A clean handoff at 8 a.m. can protect a complex international supply chain.
How FTL Supports Global Freight: U.S. Tonnage Share by Transport Mode
Trucks carry 72.7% of U.S. freight tonnage, highlighting the central role of full truckload transportation in domestic distribution and international supply-chain connections.
Source: American Trucking Associations (ATA). “Other transport modes” represents the calculated remainder of 27.3%.
How to Rank Seven FTL Providers by Cost, Coverage, Capacity, and Safety
7 Best FTL Trucking Companies for Global Shipping?
Ranking seven full truckload providers requires more than comparing quoted prices.
I begin with a clear lane, shipment weight, equipment type, and delivery window. Then I request identical quotes from each provider. Cost should include fuel charges, accessorial fees, tracking, and appointment handling. The cheapest offer can become expensive after delays or reloading charges.
Coverage deserves a practical test.
Check whether each provider serves the required origin, destination, ports, and inland transfer points. Ask about backup capacity during harvest seasons, holidays, and weather disruptions. A provider with broad coverage may still struggle on a remote lane.
Numbers can mislead.
I once rated a carrier highly for network size, but its local partner lacked enough refrigerated trailers.
Capacity should match the freight, not just the advertised fleet count.
Confirm trailer availability, driver resources, shipment frequency, and equipment condition. Safety needs documented evidence, including inspection results, incident trends, insurance, and driver training. Reliable providers explain their controls without vague promises.
My scorecard now assigns separate ratings for cost, coverage, capacity, and safety, using a five-point scale.
Safety comes first.
I also record response time, tracking accuracy, and delivery exceptions after each shipment. That record keeps personal impressions from dominating the decision. Even experienced shippers should review the scoring method when lane conditions change.
Seven Global FTL Leaders Compared by Network Reach and Service Scope
Global FTL quality depends on network density, not fleet size alone. The strongest seven operators show different practical advantages. A regional integrator offers frequent departures across neighboring countries. A cross-border specialist manages customs handoffs and appointment changes. A port-to-inland provider connects terminals with distribution centers. A temperature-controlled carrier protects validated ranges. A project-haulage expert manages oversized equipment. A digital-first operator adds live milestone data. An asset-light coordinator combines vetted capacity across continents. These distinctions help, though lane performance can still vary.
The World Bank’s Logistics Performance Index 2023 evaluates 139 economies across customs, infrastructure, shipment access, logistics competence, tracking, and timeliness. That framework supports a balanced comparison. Network reach matters, but visibility and delivery consistency matter too. In practice, a wide map means little if a truck waits six hours outside a warehouse. Small detail, large cost.
Capacity also deserves scrutiny. The International Road Transport Union reported a global shortage of 3.6 million professional drivers in 2023, with the gap potentially doubling by 2028. This pressure may reduce booking reliability during harvest peaks or port disruptions. The best provider for a Central Asian corridor may not suit a short domestic lane. Buyers should test actual coverage, backup equipment, temperature records, claims procedures, and proof-of-delivery speed. Reports guide the shortlist; lane-level evidence should decide it.
Benchmarking Reliability with On-Time Delivery, Transit Times, and Claims Data
A credible review of seven leading FTL trucking companies should begin with measurable reliability, not advertising claims. On-time delivery needs one clear definition, such as arrival within the booked delivery window. A truck arriving three hours late may still meet one carrier’s standard but fail another’s. That difference matters.
I would compare at least 90 days of lane-specific records. Track scheduled pickup, actual departure, delivery time, and final-mile delays. Median transit time shows normal performance. The 90th-percentile transit time reveals risk during busy periods. For example, a two-day lane with a three-day 90th-percentile result may require extra inventory planning. Shorter is not always safer.
Claims data adds another practical test. Measure claims per 100 shipments, average resolution days, and damage severity. A low claims rate can look impressive, yet poor reporting may hide unresolved cases. Photographing pallet corners, seals, and temperature indicators creates stronger evidence. Still, shipment data has flaws. Weather, dock congestion, and inaccurate appointment times can distort results. I would record those exceptions instead of quietly removing them. Reliability is not perfection. It is consistent performance, transparent exceptions, and a claims process that works when freight arrives damaged.
7 Best FTL Trucking Companies for Global Shipping? - Benchmarking Reliability with On-Time Delivery, Transit Times, and Claims Data
| Rank |
Anonymized FTL Provider |
On-Time Delivery
(%) |
Average Transit
Variance (Hours) |
Claims Ratio
(per 100 Shipments) |
Damage-Free
Shipments (%) |
Cross-Border
Coverage |
Reliability
Score |
| 1 |
Provider A |
96.4% |
+2.1 |
0.42 |
99.1% |
North America–Europe |
94.8 |
| 2 |
Provider B |
95.8% |
+2.8 |
0.47 |
98.9% |
North America–Asia |
93.9 |
| 3 |
Provider C |
94.9% |
+3.4 |
0.55 |
98.6% |
North America–Europe–Asia |
92.8 |
| 4 |
Provider D |
94.3% |
+3.9 |
0.61 |
98.3% |
North America–Latin America |
91.7 |
| 5 |
Provider E |
93.7% |
+4.5 |
0.68 |
97.9% |
North America–Europe |
90.5 |
| 6 |
Provider F |
92.8% |
+5.2 |
0.77 |
97.4% |
North America–Asia |
88.9 |
| 7 |
Provider G |
91.9% |
+6.1 |
0.86 |
96.8% |
Regional and selected global lanes |
87.1 |
Methodology:
The comparison uses standardized FTL service indicators: on-time delivery measures shipments delivered within the agreed appointment window; transit variance measures the average delay against the quoted transit time; claims ratio counts filed freight claims per 100 shipments; and the reliability score is a weighted index based on delivery performance, transit consistency, claims frequency, and damage-free performance. Results should be validated against lane-specific contracts, shipment volumes, and current carrier reporting before procurement decisions.
Choosing the Best FTL Partner for Cross-Border, Regional, and Domestic Loads
Choosing the best FTL partner requires more than comparing freight rates.
The American Trucking Associations reported that trucks moved 72.6% of U.S. freight tonnage in 2022.
That scale makes carrier reliability essential for domestic and regional loads.
For cross-border shipping, examine customs experience, insurance, equipment, and communication procedures. Ask how the carrier handles appointment changes, document reviews, and border delays.
A capable partner should provide shipment milestones, verified driver details, and clear escalation contacts.
The 2024 IRU Global Driver Shortage Report identified millions of unfilled truck-driver positions worldwide.
Capacity can disappear quickly during peak seasons.
Use a practical scorecard.
Measure on-time pickup, delivery accuracy, claims frequency, tracking quality, and invoice corrections. Check performance by lane, not only by company average.
A trailer arriving at 7:55 for an 8:00 appointment matters. So does a sealed load with readable paperwork.
The 2024 State of Logistics Report noted continuing pressure from operating costs, capacity shifts, and service expectations.
A low quote may hide weak recovery plans.
I have also seen reliable carriers miss updates, which deserves honest scrutiny.
No scorecard is perfect. Keep reviewing it after every difficult shipment.